An initiative of the Community Foundation of Greater Dubuque
Inclusive Dubuque
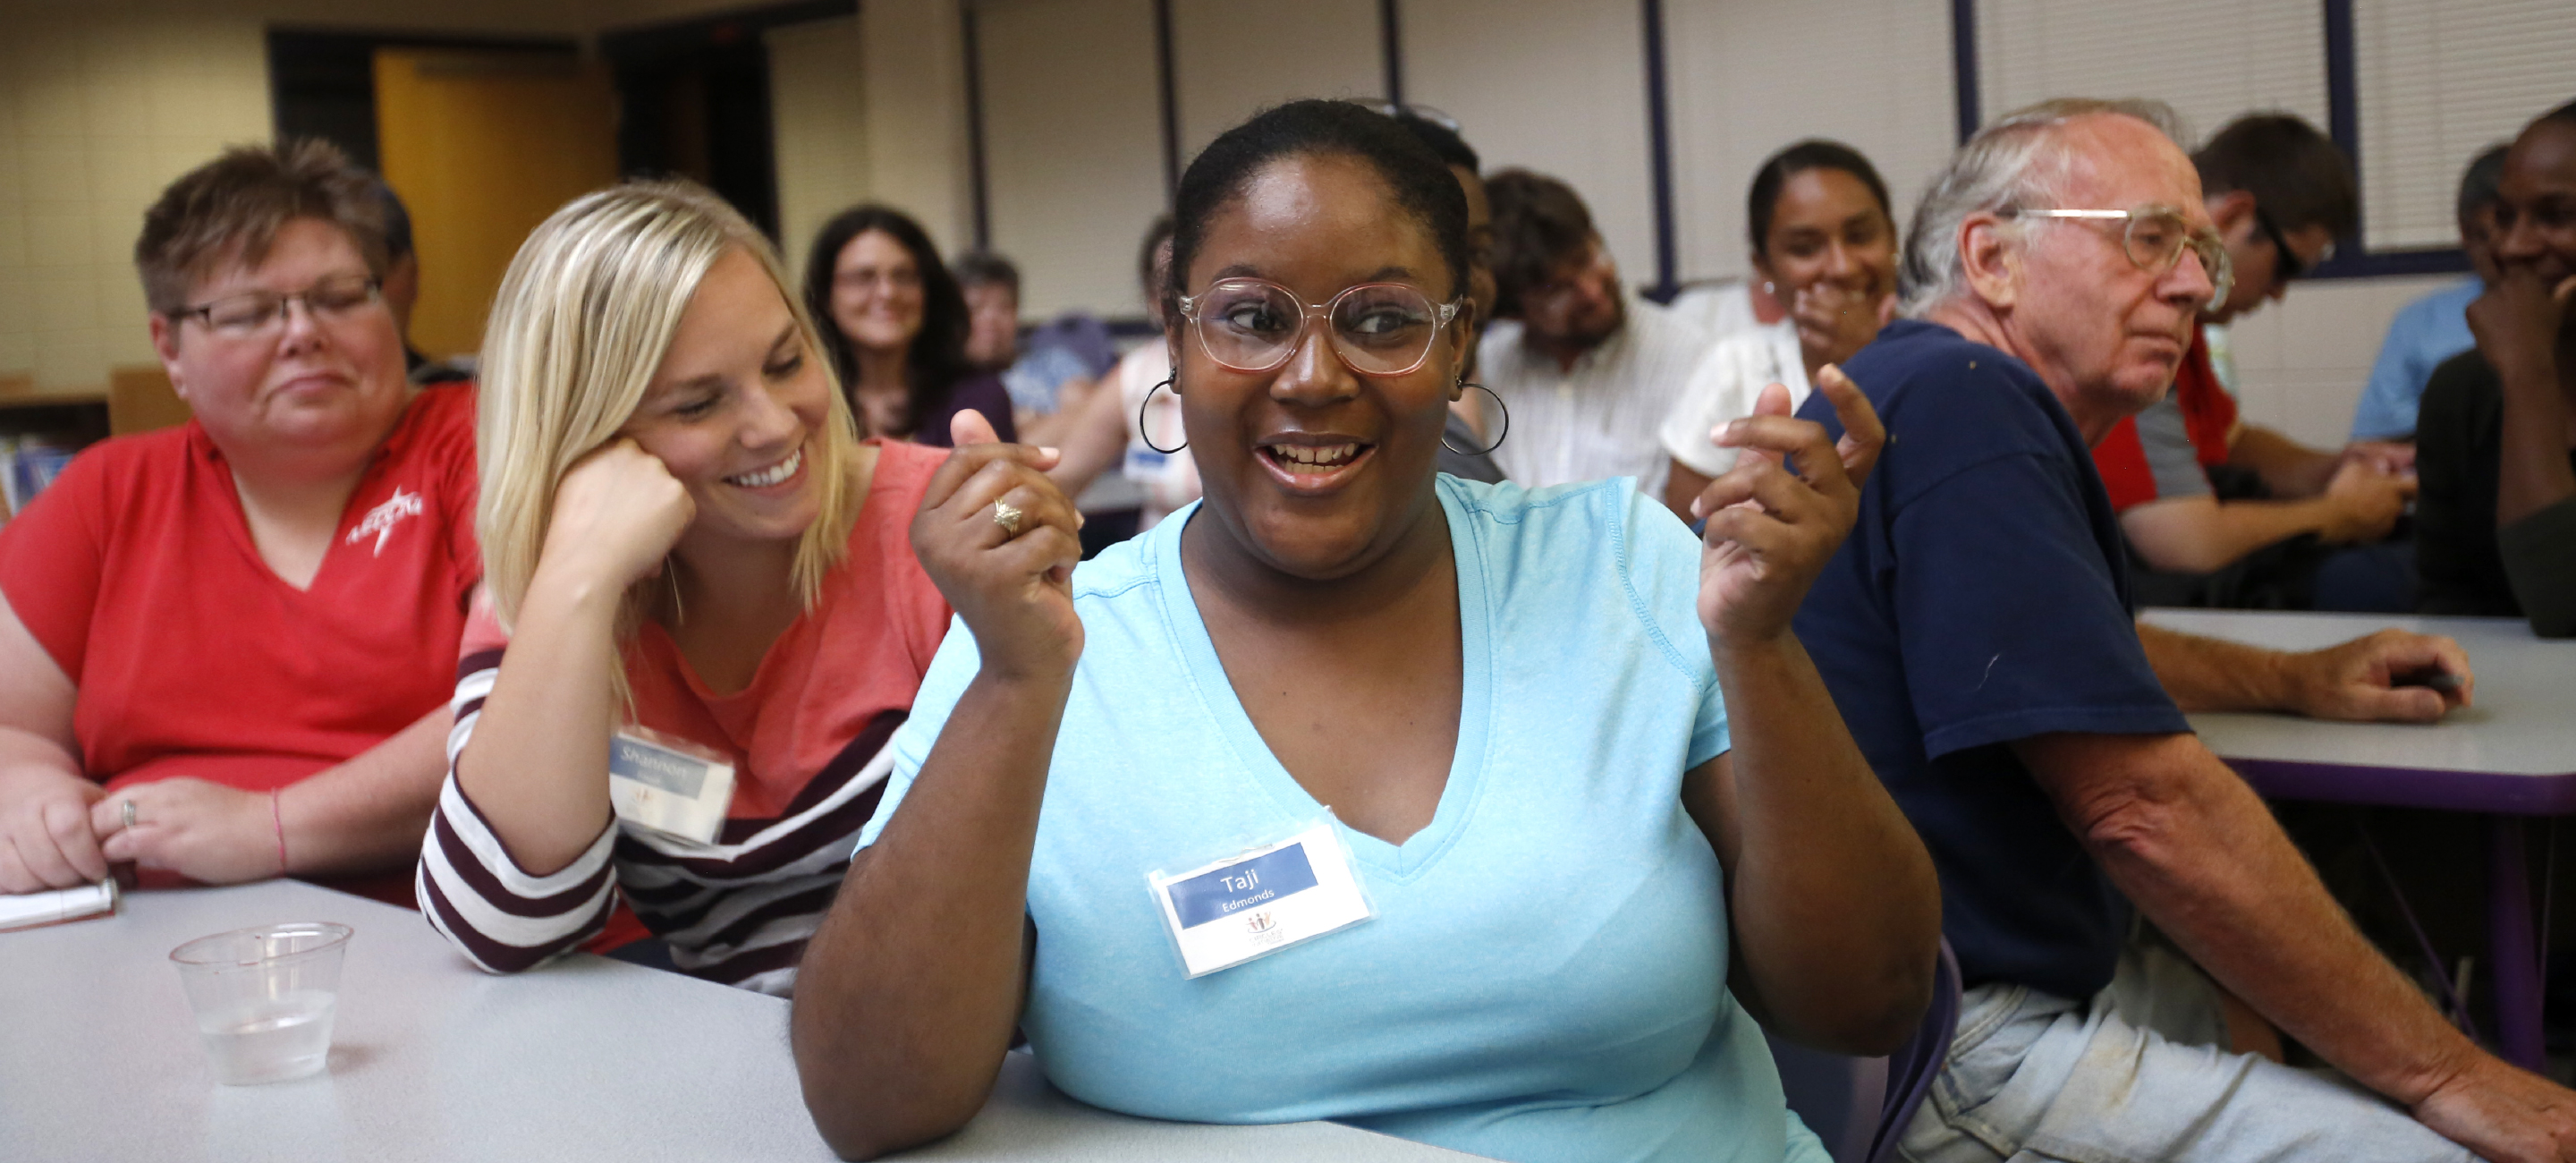

Everyone deserves to live in a place where they are respected, valued and engaged in civic life.
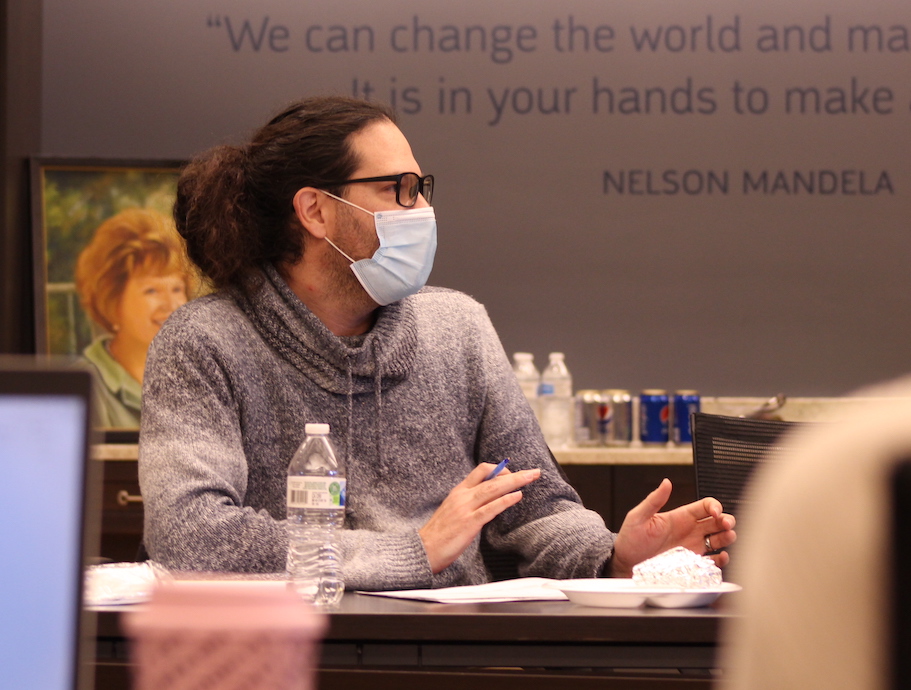
That’s the philosophy that guides the Community Foundation’s Inclusive Dubuque network. We are a diverse group of partners working together to foster a culture of inclusion and advance justice and social equity across the community.
Download our one-pagerOur Stories
Stay up to date with the latest news and relevant information about this initiative.
Featured Video
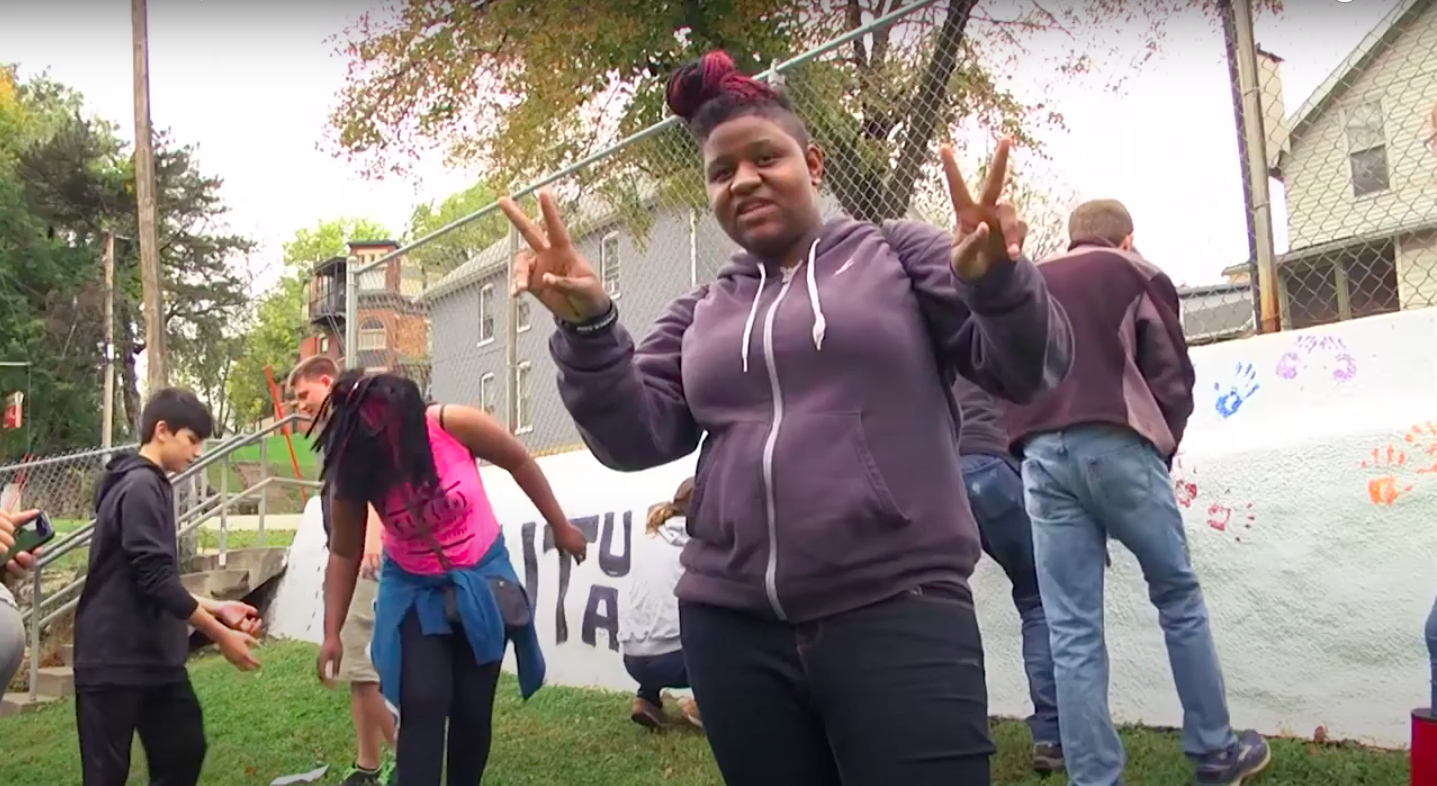
A Shared Vision for Dubuque
With a desire to understand issues and engage community members, leaders from business, nonprofits, education, government, philanthropy and the faith community came together around Inclusive Dubuque in 2012.
Upcoming Events
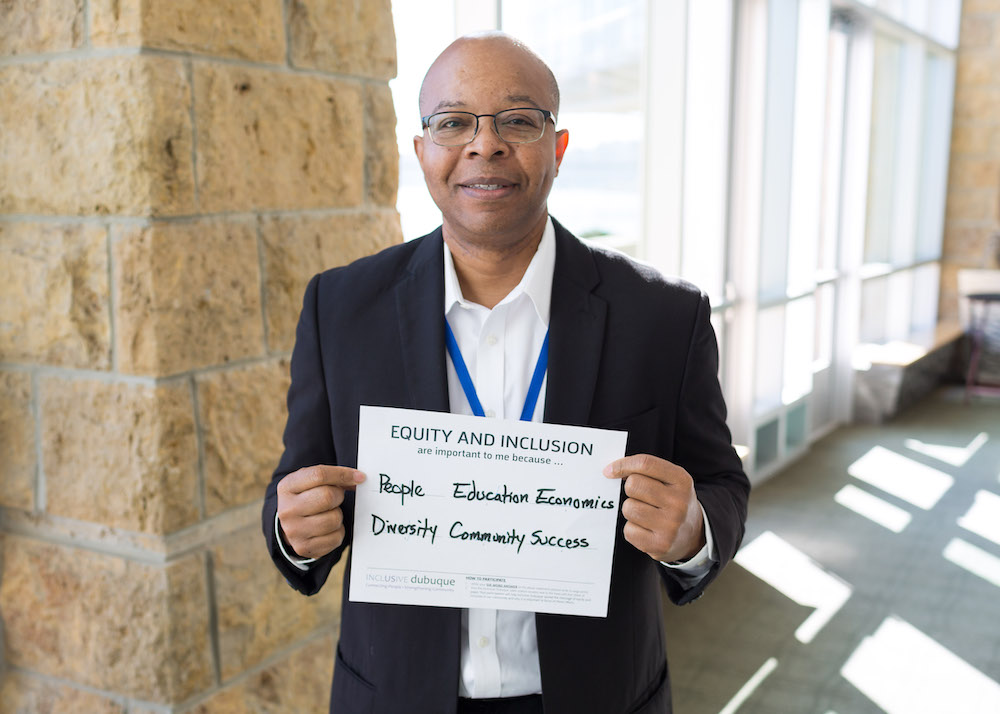
“By creating an environment in which everyone is feels welcome and supported, we can help our community continue to grow and thrive.”
A snapshot of our diverse community.*
The demographic statistics included in this summary display emerging trends in the Dubuque population.

4.1%
Residents speaking a language other than English at home.
12.2%
Residents of color.
13.2%
Residents in poverty.
Opportunities
What role can you play?
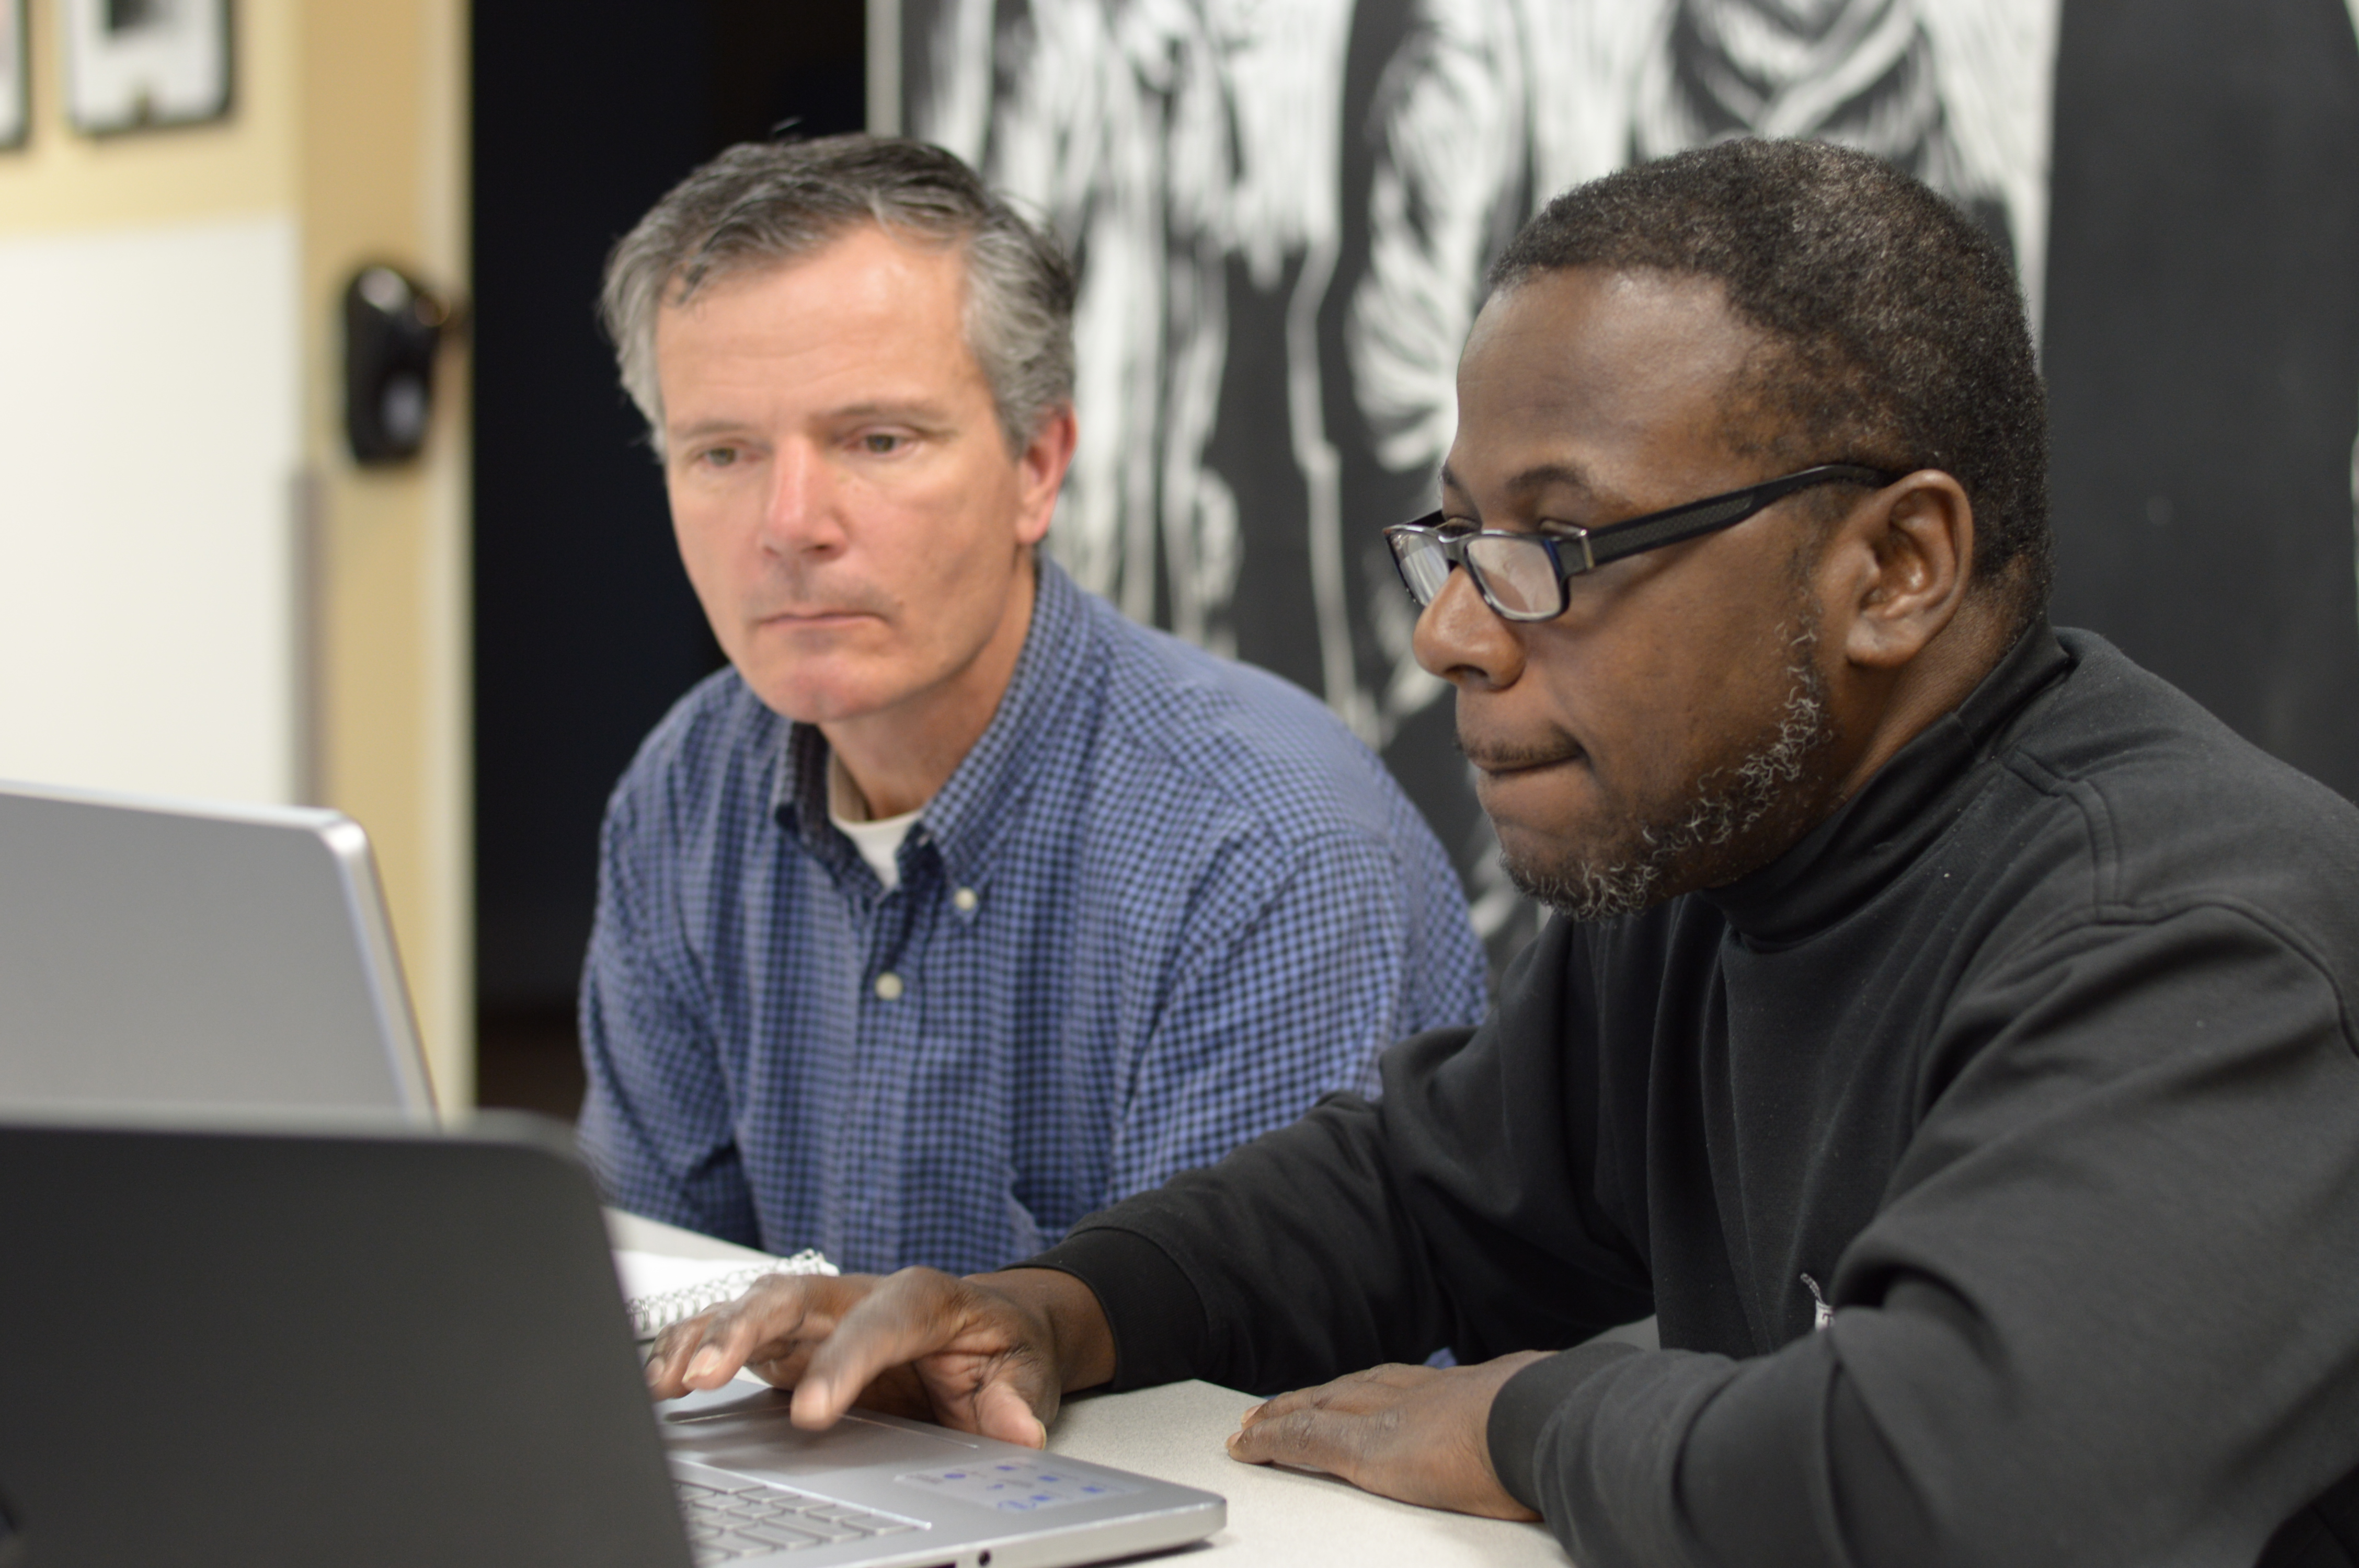
We offer an array of opportunities, resources and workshops that you can use to help build a welcoming and inclusive Dubuque region.
Featured Resource
Community Equity Profile
Our updated Community Equity Profile is now available! Learn about the experiences of Dubuque's diverse residents and how they are impacted by systems like housing, education and transportation.
Learning opportunities
Business Leader Equity Cohort
More Details
Rural Equity Network
Through this network, leaders explore topics of diversity, equity and inclusion to build informed and equitable rural communities.
More Details
Employer Inclusion Council
This group of professionals is working to recruit and retain employees through a focus on diversity, equity and inclusion efforts in their organizations.
More Details
Resources
DEI Toolkit
Find self-service resources for enhancing your staff’s knowledge of diversity, equity and inclusion issues and fostering a culture of inclusion in your organization.
Learn More

Dubuque Cultural Resource Guide
From hair salons to colleges, grocery stores to English language programs, find businesses and services that cater to your cultural or ethnic needs.
Learn More

Workplace Disability Inclusion Guide
Get an overview of why inclusive practices for people of diverse abilities is important for employers and find resources to support your policies and practices.
Learn More
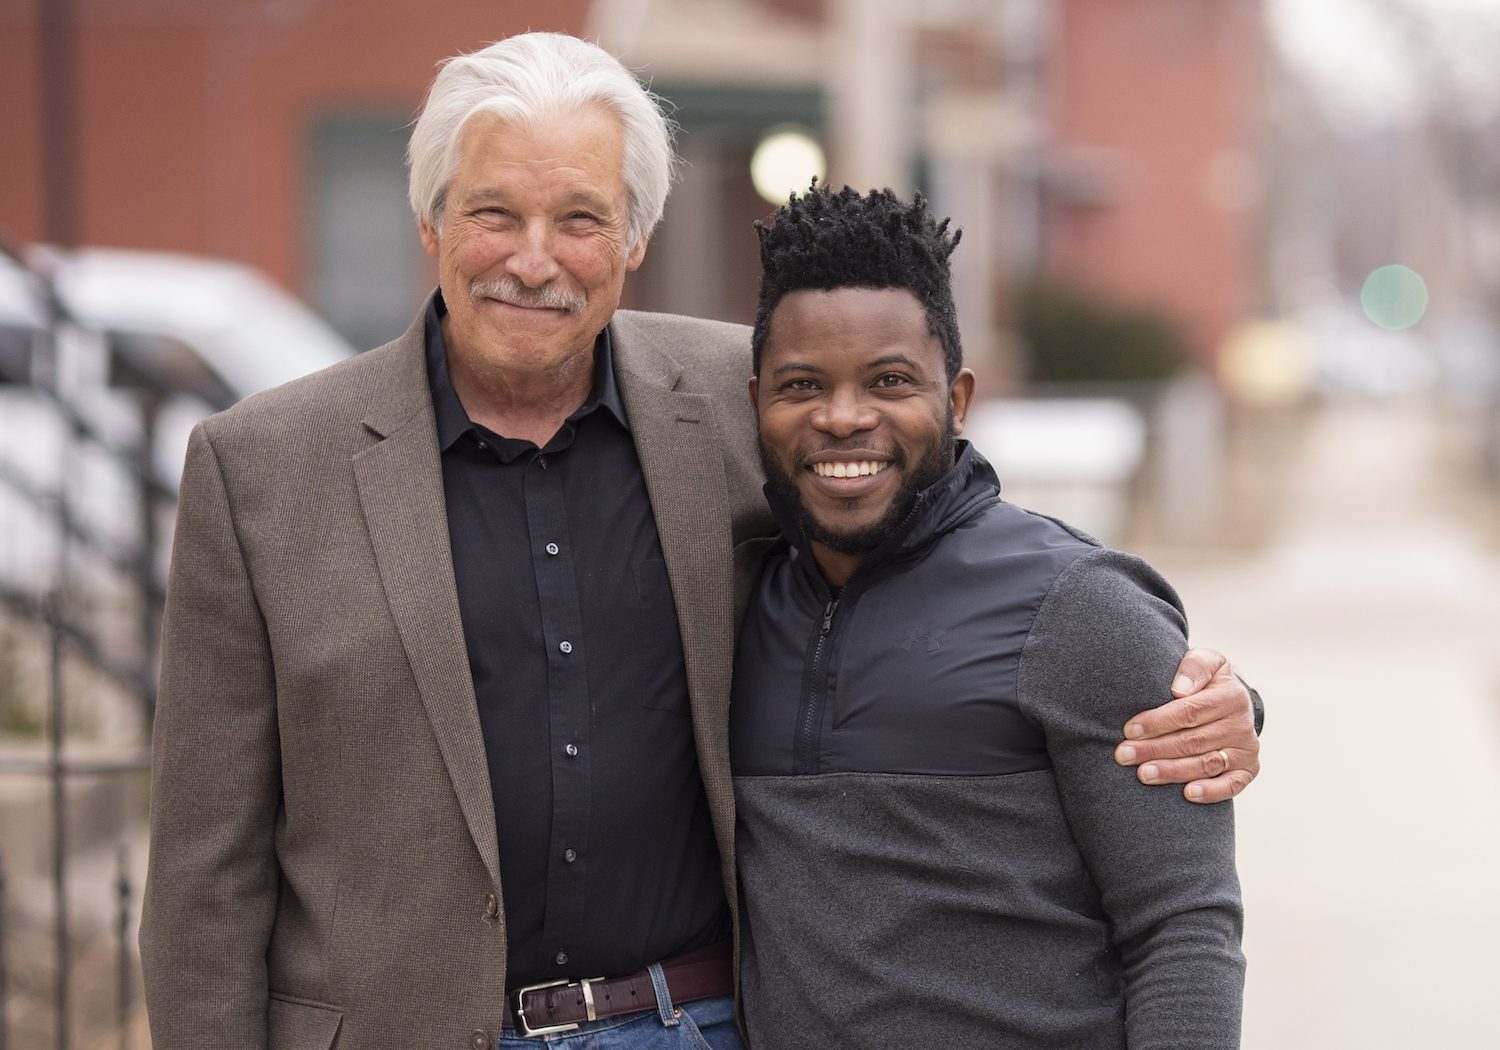
“Learning about other people is not done in a book. You have to be able to get out there and talk to different people. Inclusive Dubuque gives the opportunity for that to happen. It helps break down barriers.”
The Inclusive Dubuque Vision
An informed, equitable and inclusive community where all people feel respected, valued and engaged
Give Now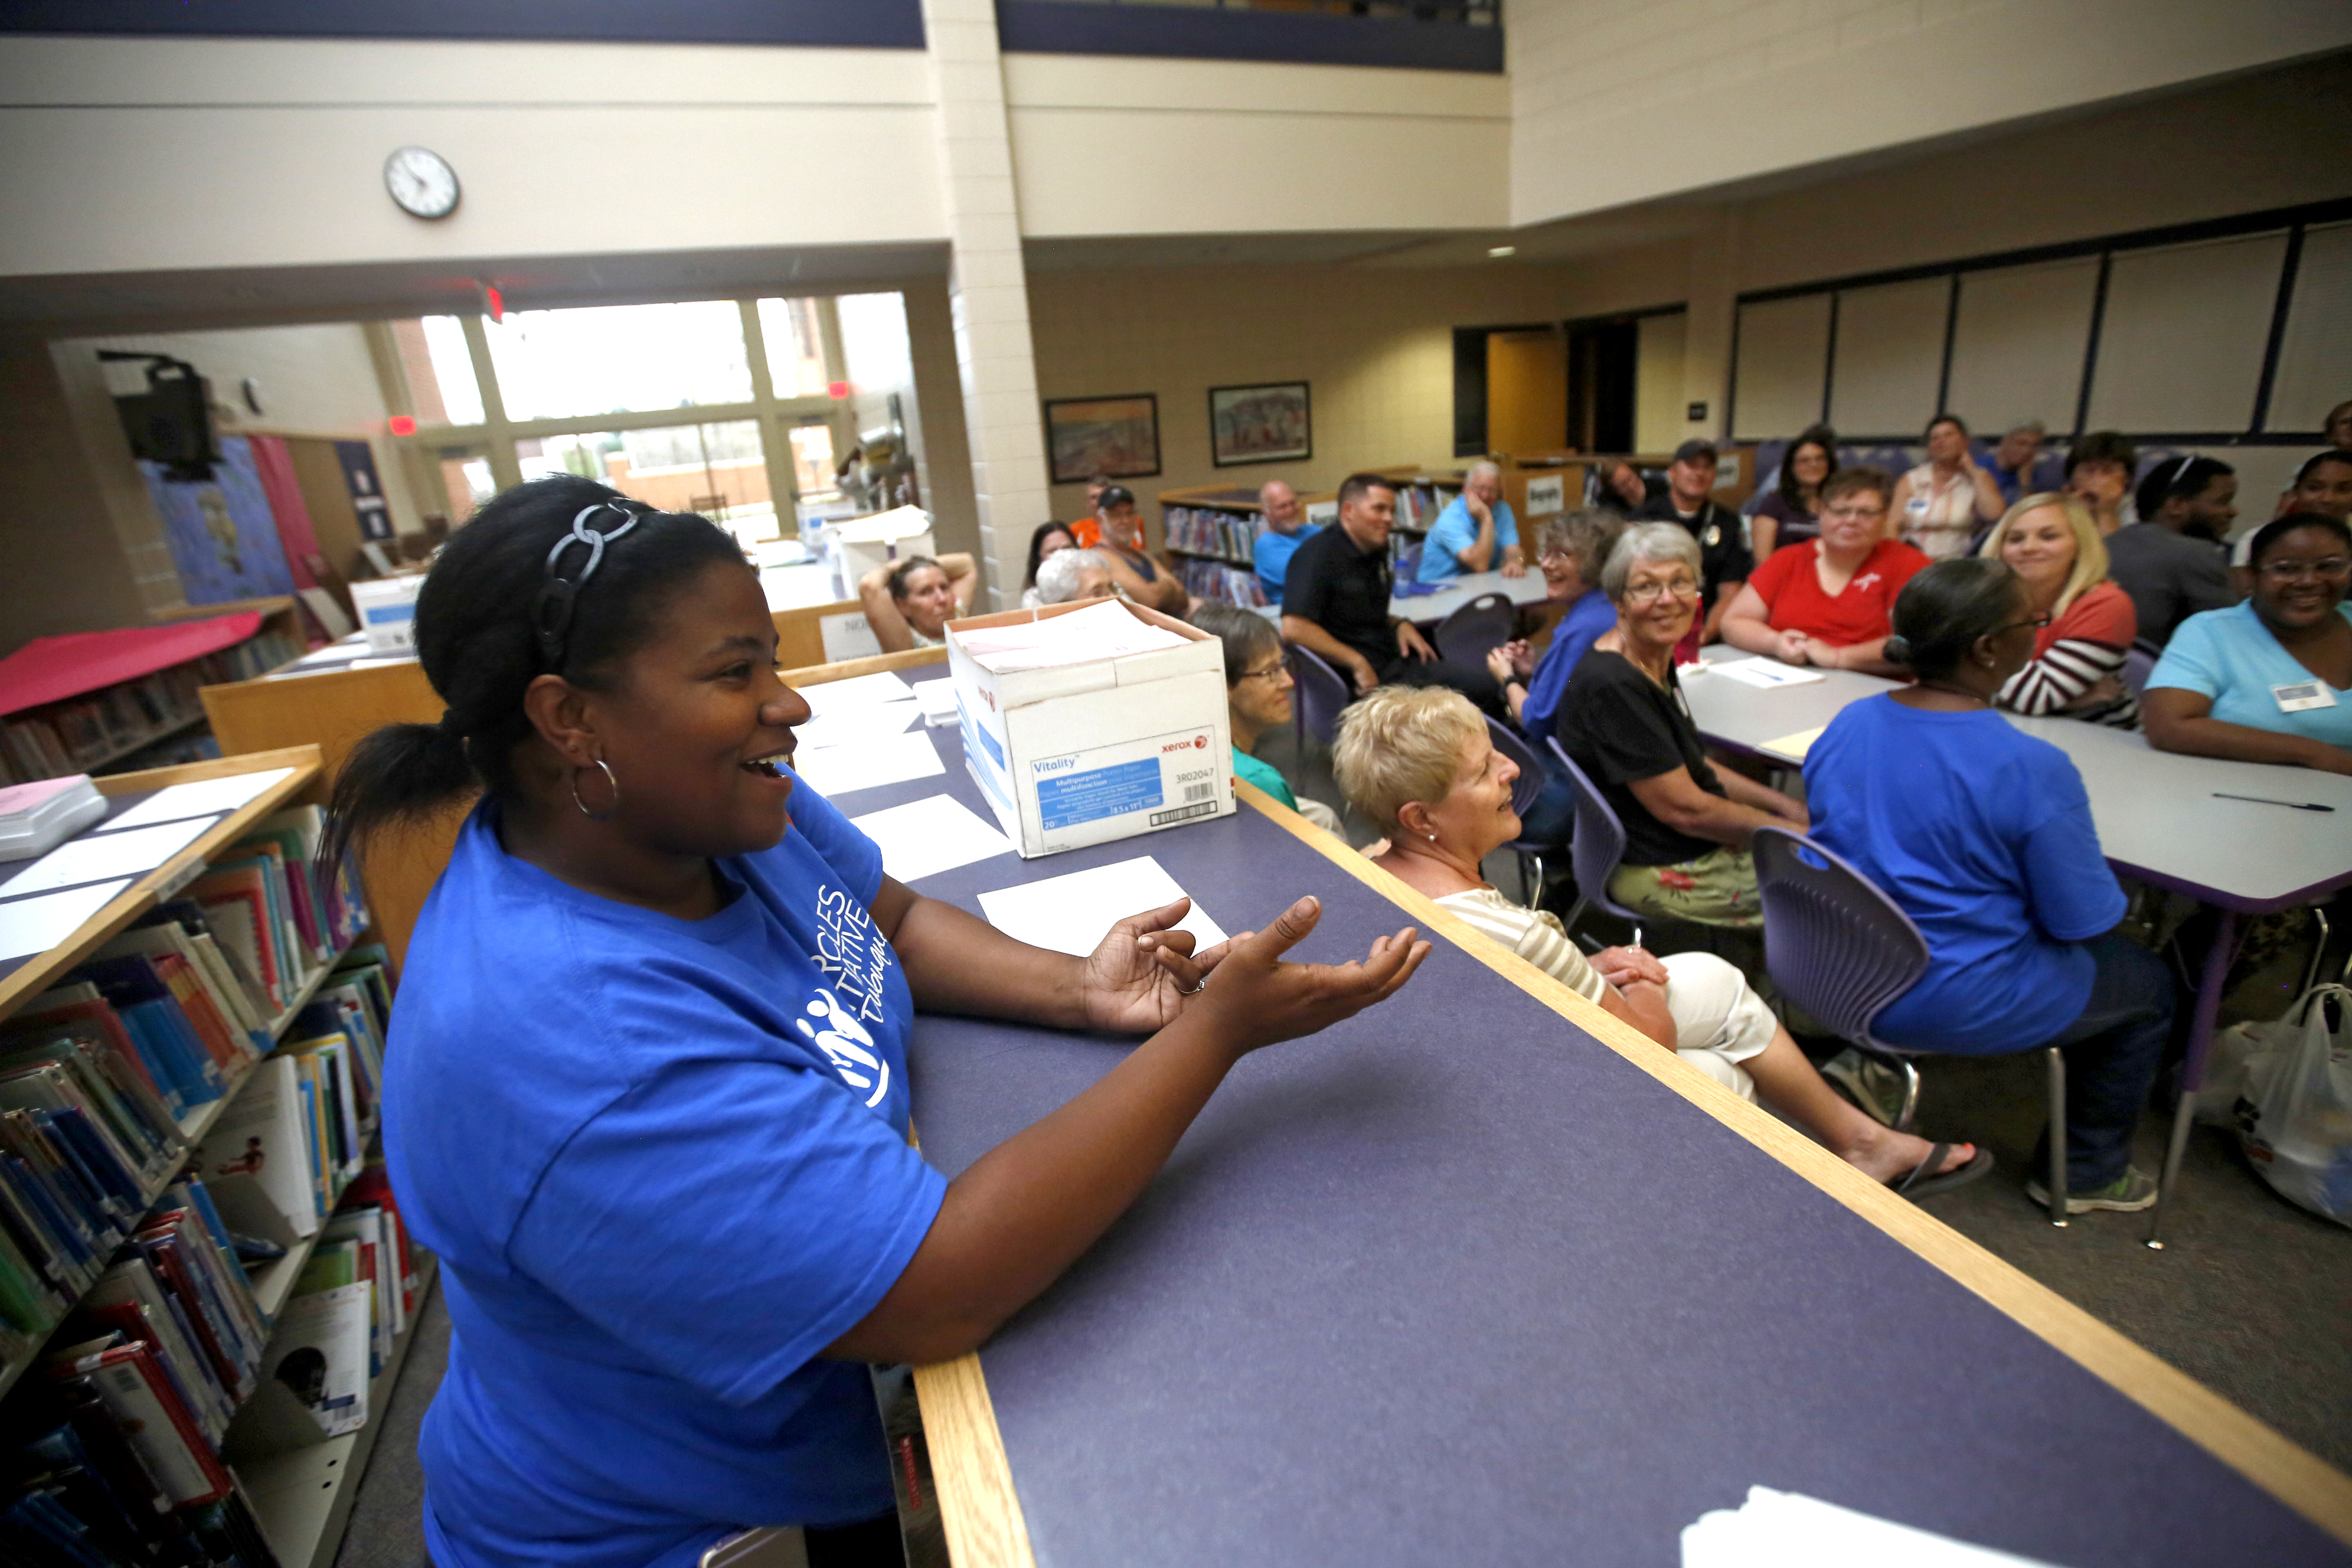
Find out how you can play a role in the Inclusive Dubuque network.