Community Equity Profile
We are pleased to share a summary of the Community Equity Profile that was launched in February 2015. It includes findings from:
- conversations with nearly 600 dialogue participants
- input from more than 2,000 survey responses
- secondary data from respected local, state and national sources.
How to Navigate the Equity Profile Summary
- Read all of the information on this page
- Familiarize yourself with Dubuque Demographics
- Choose a category to explore the data and information gathered for the Equity Profile Summary
A Note on Structural Racism
While reviewing the Equity Profile summary, it is important to keep in mind the history of our country and community that may have lead to disparities among diverse groups.
Structural racism is a system in which public policies, institutional practices, cultural representations and other norms work in various, often reinforcing ways to perpetuate racial group inequality. It identifies dimensions of our history and culture that have allowed privileges associated with “whiteness” and disadvantages associated with “color” to endure and adapt over time.
An example of structural racism was the federal mortgage policy of redlining that denied mortgages to blacks, which resulted in racial segregation to neighborhoods with declining property values. This resulted in a smaller tax base which affected school funding, as well as affecting one’s ability to generate wealth.
Acknowledging structural racism as a barrier to success for many groups does not minimize the barriers and struggles that all people may face and have to overcome. Rather, it recognizes that there have been many laws and policies in our history that have created a disadvantage for people of color, and that those laws and policies still have an effect on people’s ability to succeed today.
We must be careful not to see the data as reinforcing stereotypes, but rather to understand there are long-standing systemic and structural challenges we will have to address as we move ahead.
Equity Profile Summary: Scope of the Project
Inclusive Dubuque designed its equity profile to be a process that discovers how diverse groups are affected by various systems in the community. For the purpose of this summary, diverse groups include race, age/generation, culture, disability, gender, nationality, religion, sexual orientation, socioeconomic status, veteran status and more. Launched in February 2015, the equity profile sought to gather local data, along with feedback from community members in seven different focus areas: economic wellbeing, housing, education, health, safe neighborhoods, transportation and arts/culture. Inclusive Dubuque’s goal in sharing this equity profile summary is to inform community leaders, community members and policymakers in order to transition from gathering information to creating an action plan that will support Dubuque’s growth as an equitable and inclusive community.
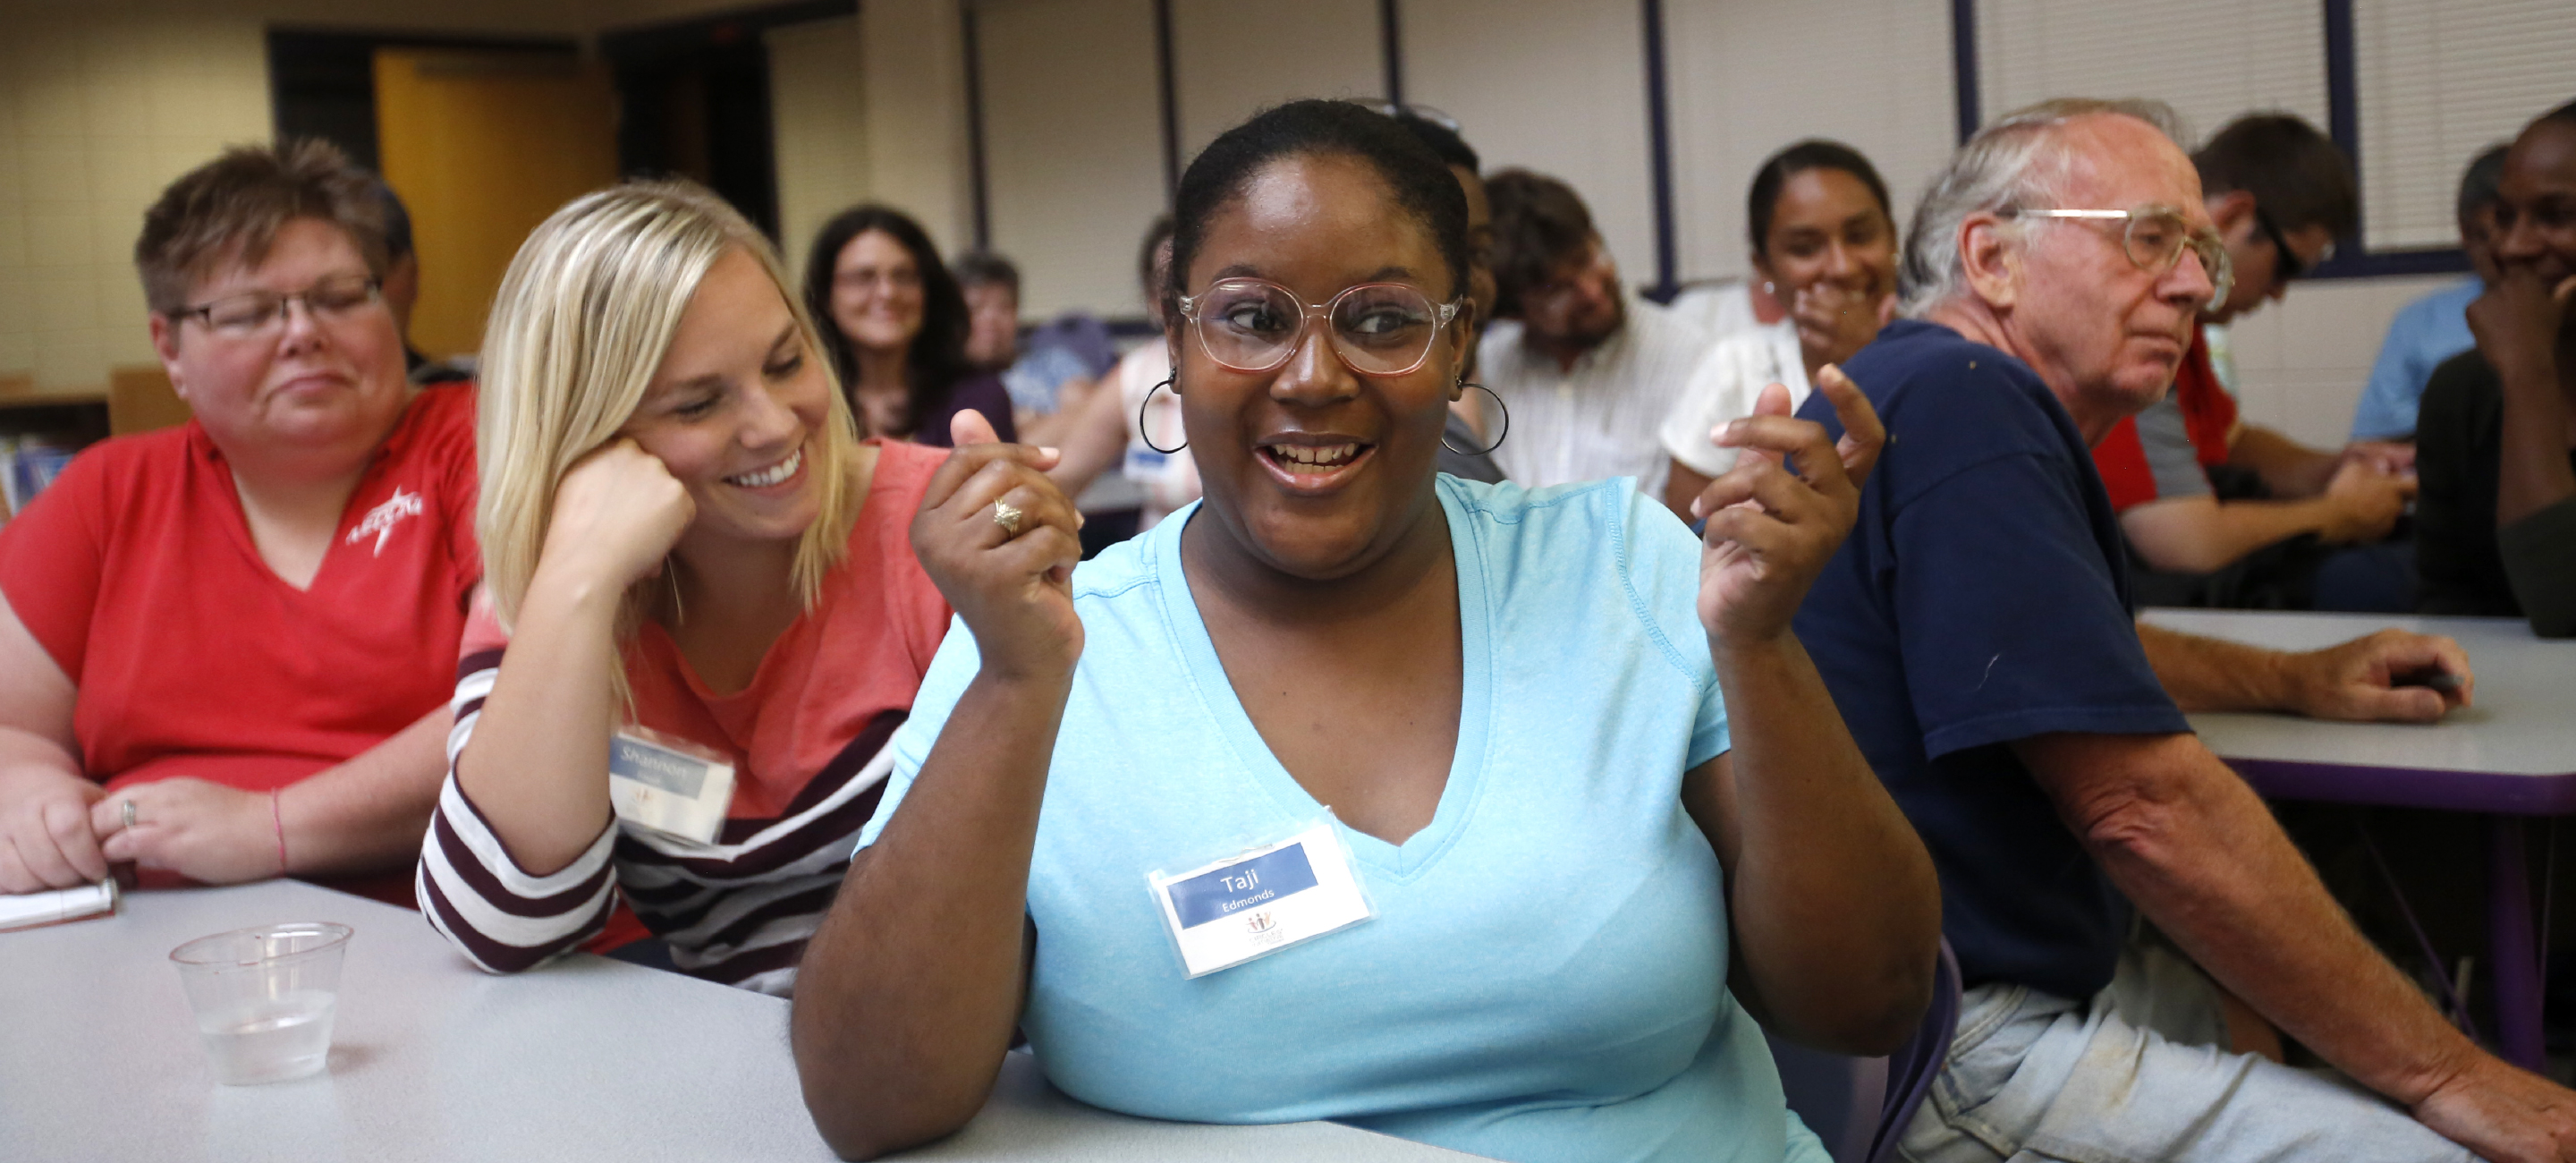
The equity profile process began in February 2015 when Inclusive Dubuque hosted community dialogues each month, for seven months, about one of the profile’s focus areas to gain insight from community members. Dialogues were hosted by a trained facilitator who encouraged participants to share their perspectives, stories and experiences. In addition to the community dialogues, surveys were distributed to community members both online and in print form.
The profile’s ambitious goal to include all diverse groups and that presented a challenge: data does not exist for all groups and areas. Quantitative data is typically not broken down by religious beliefs, sexual orientation, disability, etc., which is why these groups are not represented in the quantitative data on this site. This is where the use of qualitative data—feedback from surveys and community dialogues—was beneficial to help fill in the gaps.
The data from surveys and dialogues, although not scientifically collected, helped provide context to go along with the quantitative data. Community engagement helped to bring people together, giving them a voice on the topic of equity and inclusion. Participating individuals and groups connected with each other and also with Inclusive Dubuque.
This equity profile summary provides an overview of the data and community feedback from dialogues and surveys, allowing us to discover disparities that exist among diverse groups in Dubuque. This summary was designed to be a baseline tool to engage the community. The data was collected in 2015 to provide a baseline for the community and will not be updated as new data is made available.
-
Opportunities and Accessibility
During the community dialogues, as well as in the surveys, participants were asked to share their experiences with the arts and culture scene in Dubuque. Quantitative data in this category was difficult to obtain as there is not readily available data regarding equity and inclusion in arts and culture. FROM THE SURVEY: Overall, 80.4% of […]
-
Student Achievement by Race/Ethnicity
The data also shows a gap in achievement between different races/ethnicities. In the DCSD, 72.50% of White students and 83.30% of Asian students meet reading proficiency in grades 6-8, while 34.70% of Black students and 64.70% of Hispanic students meet proficiency in this category. FROM THE SURVEY: There were no comments directly related to this […]
-
Poverty Rate by Age/Gender
FROM THE SURVEY: Survey respondents expressed concern about low and stagnant wages in Dubuque. In relation to this, survey respondents commented on rising taxes, inflation and the cost of living in regards to earning a low wage. FROM THE DIALOGUES: Many dialogue participants felt that the only jobs available in Dubuque are minimum wage […]
-
Means of Transportation
FROM THE SURVEY: There were no direct comments related to this data point on the survey. FROM THE DIALOGUES: For those who depend on the bus for transportation, the limited hours of operation offer a small time frame for transportation to work, grocery shopping, etc. Similarly, for those who work second or third shifts, public […]
-
Affordability/Quality
According to the Housing and Transportation Affordability Index, the average cost of housing and transportation in Dubuque for a household is 47% of its income. In order to be considered affordable, the index recommends that a household spend less than 45% of its income on housing and transportation. FROM THE SURVEY: Those who lived in […]
-
Neighborhood Characteristics
Because Dubuque’s population is dispersed throughout a large area (as noted in the low transit access and compact neighborhood scores), people need to own more vehicles and rely upon driving them farther distances which drives up the cost of living. FROM THE SURVEY: The top three concerns that respondents had regarding transportation were bicycle safety […]
-
Location Efficiency Metrics
A location-efficient place is compact, meaning residents are close to jobs, healthcare, grocery stores and a wide variety of businesses, or that they have access to transit to travel to these locations. According to the index, 0% of neighborhoods in Dubuque are location-efficient. This could cause a problem for those who may rely on public transportation […]
-
Racial Disparities in Marijuana Possession Arrests
According to this study completed by the American Civil Liberties Union, Iowa was the state with the highest disparity in marijuana possession arrests across the nation, with Blacks being 8.34 times more likely to be arrested for marijuana possession (2010). According to the National Household Survey on Drug Abuse and Health (2001-2010), despite the pronounced disparities […]
-
Drug Charges in Dubuque
Local arrest data in Dubuque shows a decline in drug charges for White males and Black females, but an increase in Black male and White female drug charges from 2010 to 2013. This data, obtained from the Dubuque Police Department, only reported White and Black race options. This means that all other races/ethnicities are included […]
-
Dubuque Crime Rates vs. Other Iowa Cities
The violent crime rate consistently decreased in Dubuque from 2008-2012, compared to rates in most other Iowa communities, which stayed the same or increased. The rate of property crime in Dubuque increased slightly over that five-year period. FROM THE SURVEY: Theft and property damage were the areas of highest concern for respondents. FROM THE DIALOGUES: […]